Sunday, August 24, 2008

275.24215 -14.33351 peak of extended source
275.23763 -14.33405 right side source
275.23312 -14.32476 above right source

There are many more, but these are the closest to the SNR

Starting with the peak of the extended SNR source, here's the result from several surveys (These are not as fun as SDSS)

275.24215 -14.33351:

So the positions of the sources nearest the SNR are:

USNO B1.0 with Gator:
At the position of the SNR, 275.24215 -14.33351, one source found within 5":
Distance: 3.711696"
RA: 274.241739, DEC:-14.332559, e_ra: 10, e_dec:999, b1_mag: null, r1_mag:18.83, no flags.

USNO B1.0 with "Integrated Image and Catalog Archive Service, the interface is pretty hard to make any certain conclusions from:


USNO A1.0 with the same "Integrated Image and Catalog Archive Service"


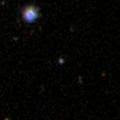
DSS seems to be pretty simple, but as the fields are dense, and the sources are close together, just looking at the results aren't too illuminative:
These are the images returned, in order of the positions listed above(the peak of the SNR flux, the source to the right, and the source above and to the right):


This so far is the best DSS query I can find- there is one on the MAST website, but it is not finding any results for the given positions in it's cross correlation query...
Just from looking at these, it seems a pretty good match for the source above at 275.23312, -14.32476, though I can't say much regarding the other two (it would have been nice to have a bright optical source associated with the xray source to the immediate right of the SNR..) Will keep trying to see if there is a better way to compare to DSS.


2Mass with Gator: no sources found within a five" radius.

This is slightly unsatisfying, as the optical catalogs don't agree conclusively. It appears that there is a possible match in the USNO B1.0 survey, but not so in A2.0.
Also, there could be a match in DSS, but it's hard to say, as it is only a picture.
At least we cannot conclusively say there ISN'T a match, unfortunately.

Friday, August 22, 2008

For G16.7, not sure what energy range I should be looking at, I am starting with .5-8 KeV for the exercise...

Tried detection methods,vtpdetect and wavdetect (as well as celldetect), on the data near the SNR to see if the detection was more accurate due to the extended nature of the source. Both methods over counted the number of sources, calling large regions "sources" that visually didn't look to be, and not defining regions of that were obviously sources. Decided to find peaks flux by hand, several ways, first smoothing the data with a Gaussian to find center. I called the peaks of flux the locations of the sources on the chip on which the SNR was detected, to compare to other catalogs.

Is it ok to just stick to the sources closer to the pointing acis? there are many other sources on the outer chips but I thought that these aren't candidates for the neutron star, or anything related to this system.

Extracted positions of sources on the chip and am in the process of comparing them to other catalogs

Monday, August 18, 2008

For 1532, (233.1062, 4745025)

At the position 233.18429 47.401489, which was closest in proximity to the expected position and the closest in flux to the Pimms estimate (though as discussed below, still much lower than the estimate) the corresponding image looks like this:


it's type is classified as a star, it's u value is 21.97 and it's g value is 21.03.
(u-g=.94)
The other chandra source, located at 232.95798 47.3968, has the following SDSS counterpart:

classified as a star and with u=22.33 and g=21.66.
(u-g=.67)
The first seems like the most probable match, not sure if the discrepencies in the flux between the Pimms estimate of the RASS flux for chandra are large enough to conclude these sources aren't matches (for both 0931 and 1532, the counts are ~an order of magnitude in difference)

Sunday, August 17, 2008

Looked at the positions of the chandra sources in SDSS. The results for 0932+027 are:


143.0399 36.50026: This is the image of the source that matched the flux estimate from RASS,however it is classified as a galaxy in SDSS- not sure how accurate that is, but I'm guessing that means we are looking at a galaxy. Its spectra looks like:


It's u=19.19 and g=17.72-
(We have log fx/fv = log fx + mv/2.5 + 5.47, but what exactly should I do as we only have u and g, also, does the median log(fx/fg) (-0.23) and 2sigma (-1.72 to +1.26) range derived from the DA set apply to DB's, or are these two DB's the way that this will be tested...?... also do )
(u-g=1.47)
(also, looks as though these are absorption lines to me, wouldn't a QSO be showing emission lines?)

Also this has already been cataloged, cross identified with ROSAT, with values of cps 0.04776 and HR1=-.61 and HR2 as -1. This is ~3 times the RASS count rate associated with our source, so again it appears to not to be the little guy.

The next image is at 142.80575 36.378942, closest in proximity to the given position of the WD, which I initially thought was a less probable candidate for a match because of it's low flux compared to the PIMMs estimate (see below), but now I'm not sure...


It is also identified as a GALAXY, with no spectroscopic information, and a u value of 22.57 and a g value of 21.89, u-g=.68 (again not sure how accurate the type specification is, not what we exactly I am expection to see for u-g).... If it is a galaxy, it is probably not a DB white dwarf (deep thoughts).

The next proximate match after these two is at 142.67369 36.56530948, and looks like this:

Also catogorized as a GALAXY, u=19.44 g=19.08, u-g=.36. Specta looked as follows:

I'm not quite sure what conclusions to draw from looking at spectra, looks like emission lines, which would also indicate a QSO- I know we are looking for a black body with lines indicating helium, but I'm not sure if these spectra are normalized in some way (this is probably very obvious but I'm not very used to interpreting spectra...) Also, this is kindof irrelevent if this is a galaxy, again.

The last two chandra sources didn't see any objects within 2 arcseconds, and manually looking around the area, the closest sources were catogorized as galaxies.....

Wednesday, August 13, 2008

Messed with parameters of celldetect and dmextract, region shapes, single and multiple chip exposure maps, to see if I could get closer results for the two threads; still pretty big discrepancies between the two.

Made table to see the general difference between results from celldetect and dmextract, as compared to each sources distance off the pointing axis of the observation. Values in table were position, counts (in the .5-8KeV range), error in counts, exposure time, flux (counts/exposure time- approximation), Del_counts (dmextract-celldetect results), Del_Pointing i.e.{[(RA1-RA2)*3600*cos(DEC1)]^2+[(DEC1-DEC2)*3600]^2}^(1/2)

Though the sample set too small to see if there is a direct correlation, it looked as though generally counts were more alike closer to pointing axis.

Compared these fluxes (which as expected differ somewhat depending on the extraction method) to Webpimms estimates based on ROSAT count rates.

Pimms estimates were as follows (temperature range between .06-.1KeV, as calculated in "The Coolest X-Ray Emitting White Dwarfs"):

0931: n_H=1.42e20, .017 cps ROSAT, temp=.1keV:
ACIS I= 2.175e-2 cps
ACIS S= 1.06e-1 cps
0.06KeV:
ACIS I=3.978e-3 cps
ACIS S=6.946e-2 cps

1532: n_H=1.7e20, .012 cps ROSAT, temp=.1keV:
ACIS I= 1.636e-2 cps
ACISS= 7.707e-2 cps
0.06KeV:
ACIS I=3.139e-3 cps
ACIS S=5.068e-2 cps

For 0931 (located at 142.8454132 36.3692741), the closest match to this estimated flux was at 143.03993 36.500260. This source is on the ACIS I array and has a flux of approximately 2.8e-2 cps (cdetect) or 4.04e-2 cps (dmextract). The closest source to the expected position of the WD was at 142.80575 36.378942; this is on the ACIS S array and it's flux (approx 5.1e-3 or 5.8e-3) is an order of magnitude lower than the estimated chandra flux, so it seems more probable to me that the former is the more probable source (not sure if that is an ok assumption- is the astrometry good enough that proximity is more indicative of possible matching.....?)

For 1532 (located at 233.1062 47.45025) both sources detected were found on the ACIS S array; the closest both in flux and position to estimates was one at 233.18429 47.401489 with a flux of approx. 9.396e-3 (cd) or 1.167e-2 (dme) cps, so if in fact one of these is a match, it seems like the most probable of the two.

These estimates were based on my assumption that the ROSAT data was taken with the HRI. Were it with the PSPC, with the same other parameters, the estimates would be:

0931: ACIS I- 5.108E-03 cps
ACIS S- 2.489E-02 cps

1532: ACIS I- 3.998E-03 cps
ACIS S- 1.883E-02 cps

I'm in the process of comparing these sources with SDSS using image list and cross ID, to see if there are matches.

Also retrieved and played around a bit in ds9 with G16.7. Next steps are to get counts, try by hand and with celldetect or wavedetect (extended source), make exposure map, play with gator and other matching catalog exercises...